STA 506 2.0 Linear Regression Analysis
Analysis of Variance, or ANOVA
Dr Thiyanga S. Talagala
Analysis of Variance (ANOVA)
a statistical method that separates observed variance in a response variable (continuous random variable) into different components to use for additional tests.
an approach to test significance of regression - if there is a linear relationship between the response Y and any of the regressor variables X1,X2,...Xp
often thought of as an overall or global test of model adequacy.
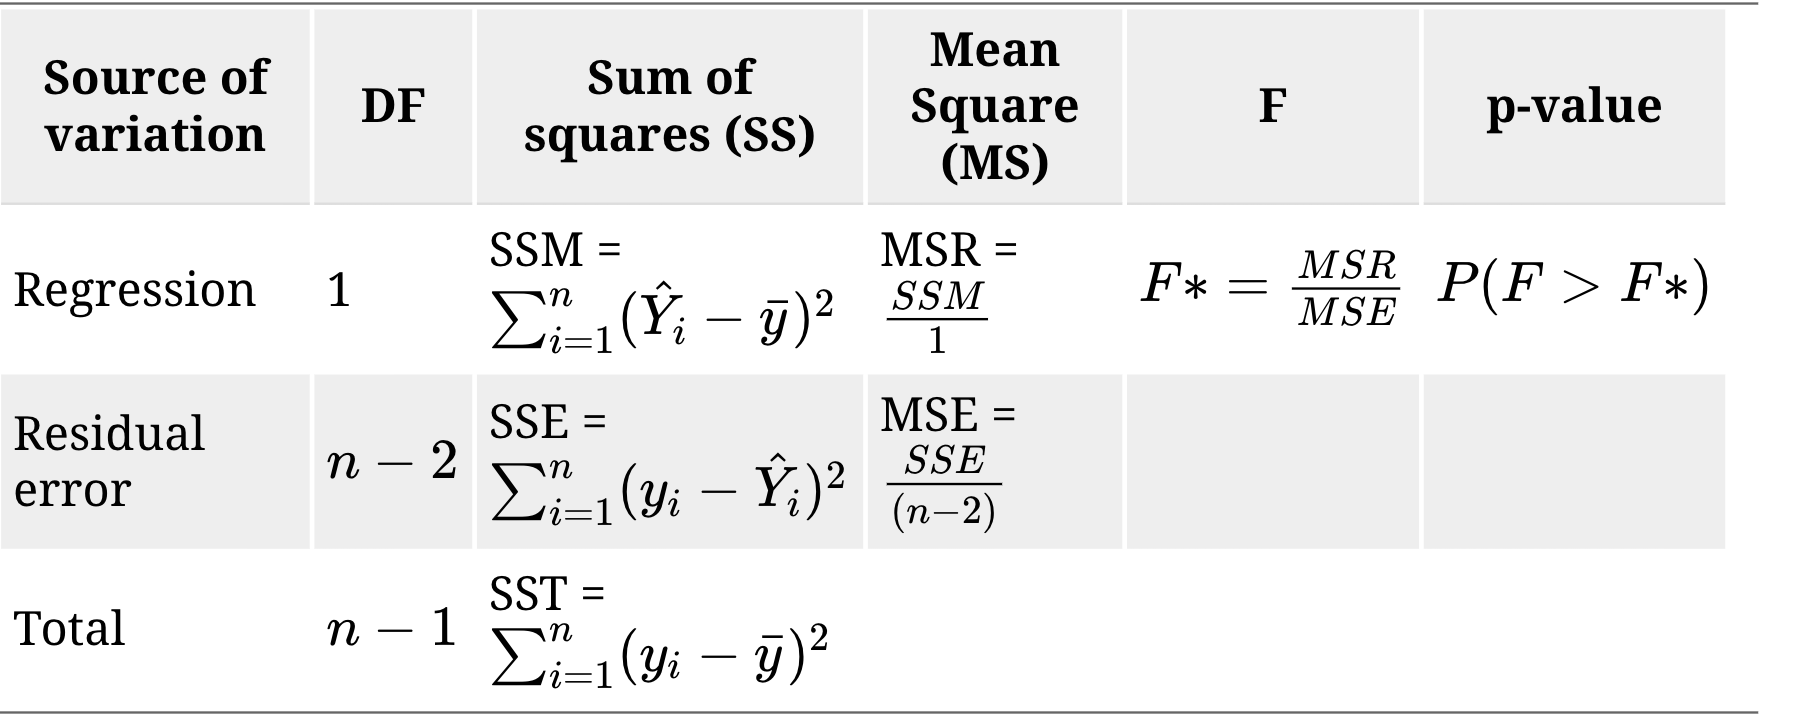
ANOVA table
| Source of variation | DF | Sum of squares (SS) | Mean Square (MS) | F | p-value | |
|---|---|---|---|---|---|---|
| Regression | 1 | SSM = ∑ni=1(^Yi−¯y)2 | MSR = SSM1 | F∗=MSRMSE | P(F>F∗) | |
| Residual error | n−2 | SSE = ∑ni=1(yi−^Yi)2 | MSE = SSE(n−2) | |||
| Total | n−1 | SST = ∑ni=1(yi−¯y)2 |
Hypotheses
H0:β1=0
H1:β1≠0
The p -value of this test is the same as the p -value of the t-test for H0:β1=0, this only happens in simple linear regression.
Simple Linear Regression Analysis - Data
library(alr3)Loading required package: carLoading required package: carDatahead(heights) Mheight Dheight1 59.7 55.12 58.2 56.53 60.6 56.04 60.7 56.85 61.8 56.06 55.5 57.9dim(heights)[1] 1375 2Simple Linear Regression Analysis
Daughter's height vs Mother's height
library(alr3)model <- lm(Dheight ~ Mheight, data=heights)anova(model)Analysis of Variance TableResponse: Dheight Df Sum Sq Mean Sq F value Pr(>F) Mheight 1 2236.7 2236.66 435.47 < 2.2e-16 ***Residuals 1373 7052.0 5.14 ---Signif. codes: 0 '***' 0.001 '**' 0.01 '*' 0.05 '.' 0.1 ' ' 1
Simple Linear Regression Analysis - ANOVA
Demo:
Simple Linear Regression Analysis - F test
Hypothesis testing with ANOVA
Analysis of Variance TableResponse: Dheight Df Sum Sq Mean Sq F value Pr(>F) Mheight 1 2236.7 2236.66 435.47 < 2.2e-16 ***Residuals 1373 7052.0 5.14 ---Signif. codes: 0 '***' 0.001 '**' 0.01 '*' 0.05 '.' 0.1 ' ' 1Test for significance of regression
Y=β0+β1X+ϵ
where
Y - daughter's height
X - mother's height
H0:β1=0
H1:β1≠0
Simple Linear Regression: F test vs t-test
summary(model)Call:lm(formula = Dheight ~ Mheight, data = heights)Residuals: Min 1Q Median 3Q Max -7.397 -1.529 0.036 1.492 9.053 Coefficients: Estimate Std. Error t value Pr(>|t|) (Intercept) 29.91744 1.62247 18.44 <2e-16 ***Mheight 0.54175 0.02596 20.87 <2e-16 ***---Signif. codes: 0 '***' 0.001 '**' 0.01 '*' 0.05 '.' 0.1 ' ' 1Residual standard error: 2.266 on 1373 degrees of freedomMultiple R-squared: 0.2408, Adjusted R-squared: 0.2402 F-statistic: 435.5 on 1 and 1373 DF, p-value: < 2.2e-16Multiple Linear Regression Analysis
Multiple Linear Regression Analysis
library(tidyverse)heart.data <- read_csv("heart.data.csv")heart.data# A tibble: 498 × 4 ...1 biking smoking heart.disease <dbl> <dbl> <dbl> <dbl> 1 1 30.8 10.9 11.8 2 2 65.1 2.22 2.85 3 3 1.96 17.6 17.2 4 4 44.8 2.80 6.82 5 5 69.4 16.0 4.06 6 6 54.4 29.3 9.55 7 7 49.1 9.06 7.62 8 8 4.78 12.8 15.9 9 9 65.7 12.0 3.0710 10 35.3 23.3 12.1 # … with 488 more rowsMultiple Linear Regression Analysis - ANOVA
| Source of variation | DF | Sum of squares (SS) | Mean Square (MS) | F | p-value | |
|---|---|---|---|---|---|---|
| Regression | p | SSM = ∑ni=1(^Yi−¯y)2 | MSR = SSMp | F∗=MSRMSE | P(F>F∗) | |
| Residual error | n−p−1 | SSE = ∑ni=1(yi−^Yi)2 | MSE = SSE(n−p−1) | |||
| Total | n−1 | ∑ni=1(yi−¯y)2 |
Hypotheses
H0:β1=β2=...=βp=0
H1:βj≠0 for at least one j, j=1, 2, ...p
The p -value of this test is not the same as the p -value of the t-test for H0:β1=0, that only happens in simple linear regression because p=1.
Multiple Linear Regression Analysis - ANOVA
Analysis of Variance TableResponse: heart.disease Df Sum Sq Mean Sq F value Pr(>F) Predictors 2 10176.6 5088.3 11895 < 2.2e-16 ***Residuals 495 211.7 0.4 ---Signif. codes: 0 '***' 0.001 '**' 0.01 '*' 0.05 '.' 0.1 ' ' 1Y=β0+β1X1+β2X2+ϵ
Y - percentage of people in each town who have heart disease
X1 - percentage of people in each town who bike to work
X2 - percentage of people in each town who smoke
Test for Significance of Regression
H0:β1=β2=0
H1:βj≠0 for at least one j, j=1, 2
Tests on Individual Regression Coefficients
Partial or marginal test
test of the contribution of Xj given the other regressors in the model.
summary(regHeart)Call:lm(formula = heart.disease ~ biking + smoking, data = heart.data)Residuals: Min 1Q Median 3Q Max -2.1789 -0.4463 0.0362 0.4422 1.9331 Coefficients: Estimate Std. Error t value Pr(>|t|) (Intercept) 14.984658 0.080137 186.99 <2e-16 ***biking -0.200133 0.001366 -146.53 <2e-16 ***smoking 0.178334 0.003539 50.39 <2e-16 ***---Signif. codes: 0 '***' 0.001 '**' 0.01 '*' 0.05 '.' 0.1 ' ' 1Residual standard error: 0.654 on 495 degrees of freedomMultiple R-squared: 0.9796, Adjusted R-squared: 0.9795 F-statistic: 1.19e+04 on 2 and 495 DF, p-value: < 2.2e-16Tests on Individual Regression Coefficients (cont)
Call:lm(formula = heart.disease ~ biking + smoking, data = heart.data)Residuals: Min 1Q Median 3Q Max -2.1789 -0.4463 0.0362 0.4422 1.9331 Coefficients: Estimate Std. Error t value Pr(>|t|) (Intercept) 14.984658 0.080137 186.99 <2e-16 ***biking -0.200133 0.001366 -146.53 <2e-16 ***smoking 0.178334 0.003539 50.39 <2e-16 ***---Signif. codes: 0 '***' 0.001 '**' 0.01 '*' 0.05 '.' 0.1 ' ' 1Residual standard error: 0.654 on 495 degrees of freedomMultiple R-squared: 0.9796, Adjusted R-squared: 0.9795 F-statistic: 1.19e+04 on 2 and 495 DF, p-value: < 2.2e-16H0:β1=0 vs H1:β1≠0
p−value<0.05, we reject H0 under 0.05 level of significance and conclude that the regressor biking or X1, contributes significantly to the model given that smoking, X2 is also in the model.
Partial test for smoking
Write down the hypotheses
Write the decision and conclusions
Next Lecture
More work - Multiple Linear Regression
Acknowledgement
Introduction to Linear Regression Analysis, Douglas C. Montgomery, Elizabeth A. Peck, G. Geoffrey Vining
Data from
https://www.scribbr.com/statistics/multiple-linear-regression/
All rights reserved by